Tell the story of your impact
Submittable’s Impact Reports aggregate qualitative and quantitative data, empowering you to demonstrate the impact of your program easily to all stakeholders.
Insights in an instant
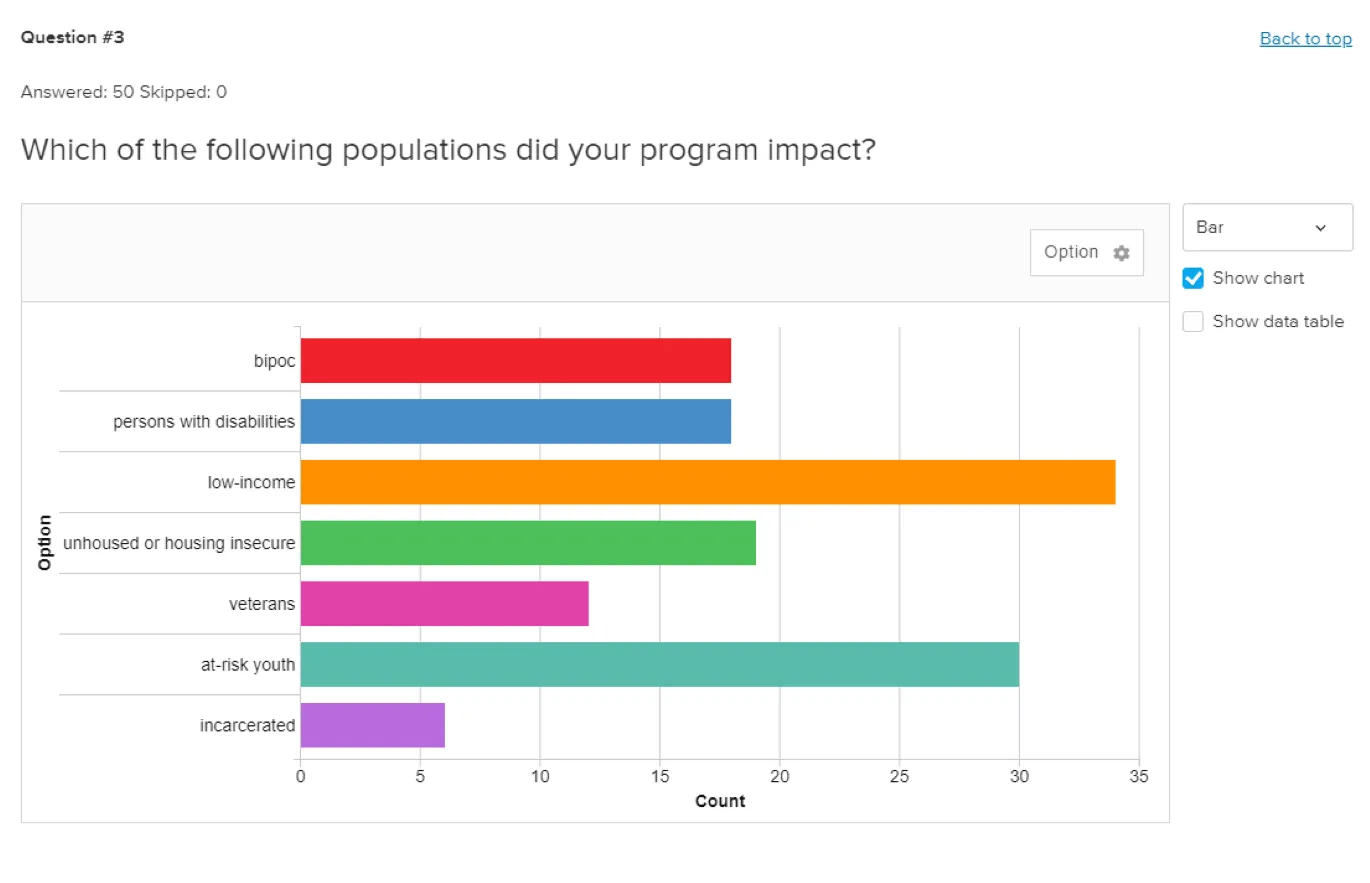
Visualize statistical data
Navigate between pie, bar, and column charts, and filter responses in or out based on your needs.
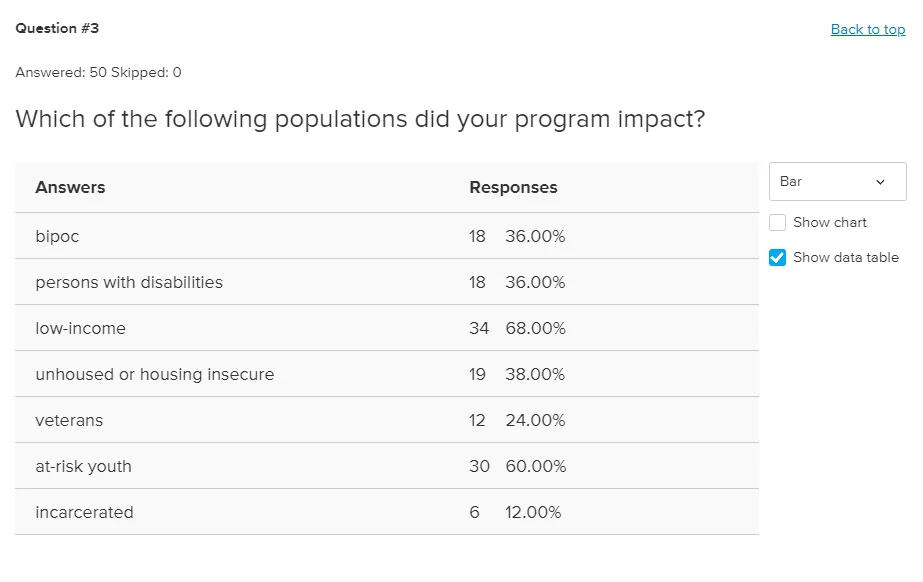
Answers at your fingertips
Data tables show you the number and percentage of applicant responses—no need to crunch numbers.

Skim narrative data
Easily skim qualitative data including short and long answer responses.
Measure progress against your larger goals
Your program is ultimately about creating lasting change. Reporting on your impact is a key way that you can track progress and make the necessary decisions to get you closer to your vision.
The easy way to understand your impact
For many, reporting on impact is enormously time-consuming—or worse, impossible to wrap your head around at all. Now, it’s completely automated—you can run a quick report, and have answers at your fingertips.
Get answers to your most important questions instantly (no more exporting to Excel).
Reduce applicant burden with a centralized system, enhance transparency and responsiveness, and make it easier to act on important feedback.
Play with pie, bar, and column graphs and find the best way to visualize your impact.
Give stakeholders, such as your board, funders, or community members, access to your report for streamlined transparency and accountability.
Gathering impact data in narrative form lets you put the stories of the real people you helped front and center.
Identifying lessons learned gives you the insight you need to make changes and improve your work for the long term.
It's easy to get started
Get a a personalized demo and help you find the perfect plan for your team.