A Taxpayer ROI maturity model for government grantmakers

The concept of Taxpayer ROI is simple enough. Public money should create public value, and we should be able to show that value in ways that taxpayers, legislators, oversight bodies, and program staff all understand.
Many governments try to measure Taxpayer ROI by assigning it a single number. Something like a benefit-cost ratio or a savings estimate. But a single number can’t capture the full picture. Government grantmakers need a maturity model.
The three categories of Taxpayer ROI
My friend Matt Hanson from Witt O’Brien’s Ambipar Center for Grants Excellence recently wrote about Taxpayer ROI. In practical terms, Taxpayer ROI describes the measurable return that taxpayers receive on each public dollar spent. As Matt pointed out, it can be understood through three complementary categories:
Fiscal ROI
The direct financial impact on a government’s own balance sheet, including cost savings, avoided expenditures, or new revenue generation.
Economic ROI
The broader economic and social value created for the community, such as increased earnings, reduced healthcare or justice-system costs, economic multipliers, or improved long-term societal outcomes.
Effectiveness ROI
The degree to which programs achieve better outcomes per dollar compared to baselines, peers, or prior years, particularly when monetization is not appropriate or feasible.
A mature grants ecosystem should ideally produce evidence across all three areas, ranging from narrow fiscal stewardship to community-wide economic value to performance-based effectiveness. But simple ideas get complicated the moment they collide with real grant programs, staffing shortages, data limitations, and unclear mandates about what must be measured and why.
The reality is that Taxpayer ROI is not a single number. It is a set of capabilities that grow over time as governments strengthen data collection, evaluation practices, performance frameworks, and cross-sector relationships.
There is no single measurement. There is a maturity curve, and each step on that curve improves the government’s ability to quantify Fiscal, Economic, and Effectiveness ROI in increasingly sophisticated ways.
Most importantly, governments can only measure Taxpayer ROI if their nonprofit partners can supply meaningful evidence of outcomes. In other words, Taxpayer ROI is a shared capability. It lives between grantmakers and grantees, and it improves only when both groups move forward together.
Where grants management software fits into ROI
A grants management software (GMS) does not, by itself, generate ROI. But it creates the conditions that make ROI achievable and measurable.
At the most basic level, a GMS is the system of record that captures the core inputs of any grant program: applications, budgets, obligations, expenditures, progress reports, and required documentation. As maturity increases, the system becomes the mechanism through which governments standardize output indicators, collect verified outcome data, embed performance frameworks, and ensure that reporting is structured and consistent across programs.
A government’s maturity level is largely determined by how deeply its GMS is configured to support the data, definitions, and processes required at each stage. Without standardized data fields, structured reporting templates, and workflow controls, agencies simply do not have the information needed to calculate outcomes, costs per outcome, avoided costs, economic value, or any type of return.
To illustrate how each maturity level builds on the last, we'll follow a single example: PathForward Tech Training Initiative, a $500,000 workforce development grant to train 100 unemployed and underemployed adults in high-demand tech skills. At each level, we'll show what reporting looks like — and what it makes possible.
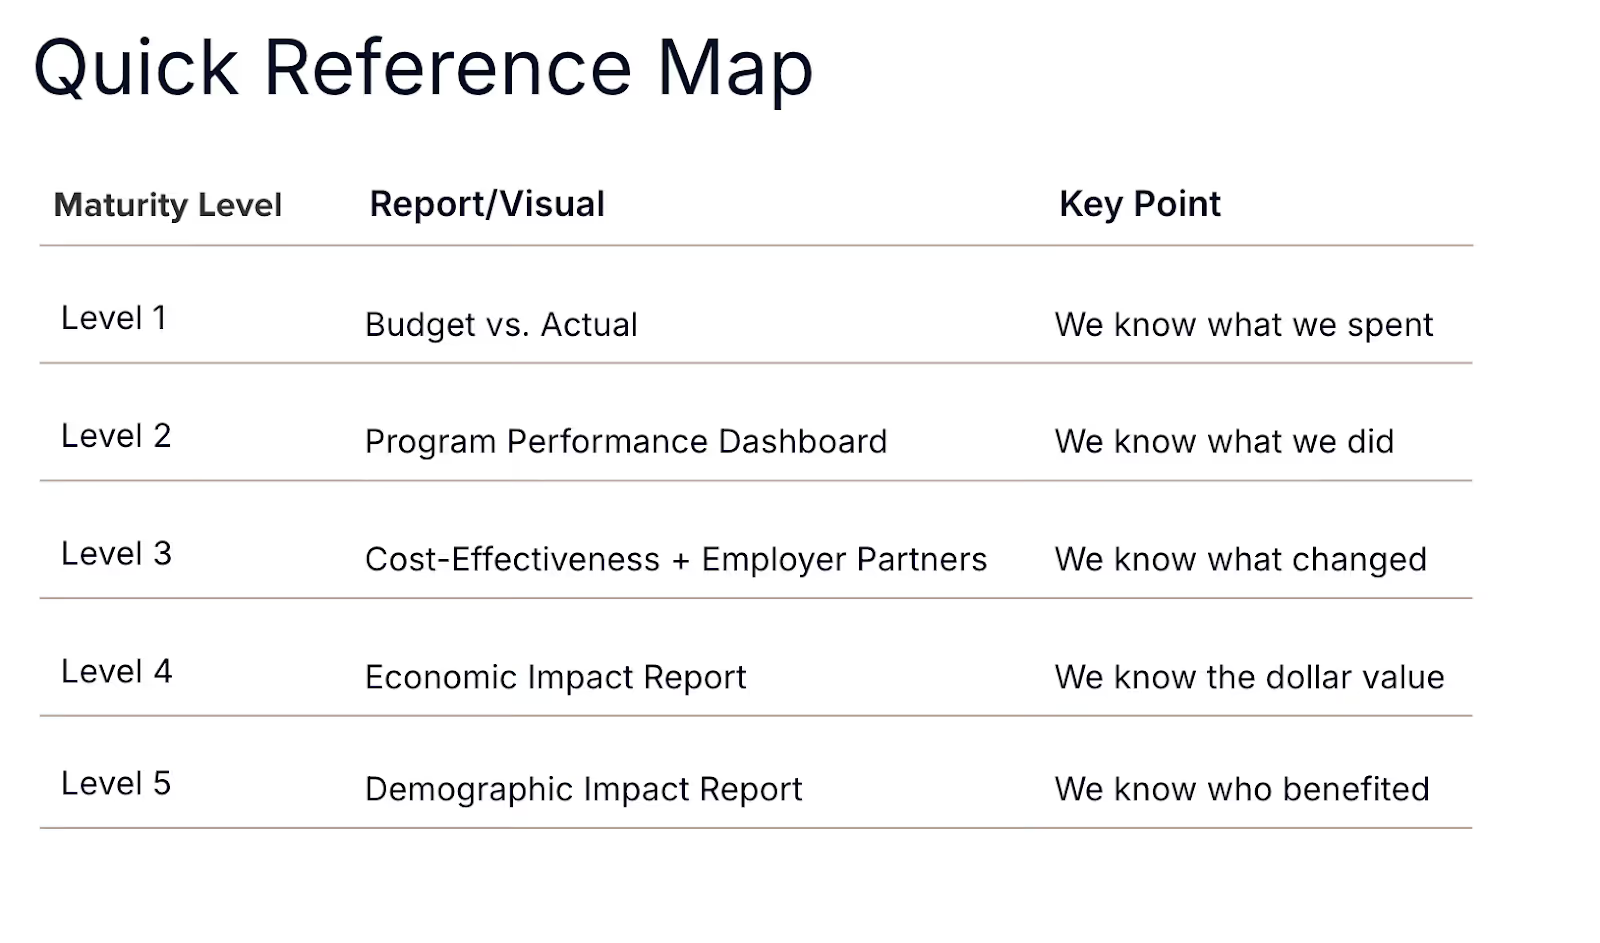
The five-stage Taxpayer ROI maturity model
The full maturity model describes how governments and nonprofits evolve from simple compliance reporting to a sophisticated and equitable view of public value across fiscal, economic, and effectiveness ROI. The goal is to create a clear path so that every government can reach the highest level of maturity.
Level 1: Initiation
“We track spending, not impact.”
At this stage, governments meet basic compliance requirements, and nonprofits fulfill the minimum obligations in their awards. Reporting is almost entirely activity based. There is no common outcomes framework. Data is collected for audits rather than learning.
Government characteristics at level 1
Governments gather expenditure reports, line-item budgets, and evidence of allowable costs. Reporting focuses on obligations and drawdowns. Monitoring examines internal controls and documentation rather than performance. Performance plans may exist but are largely disconnected from data in the field.
Recipient characteristics at level 1
Recipients provide narrative summaries, receipts, and content that resembles a diary more than an evaluation. Data may live in spreadsheets created by staff who inherited the role rather than built the system.
Role of the GMS at level 1
The GMS functions primarily as a digital filing cabinet. It stores documents, tracks basic financial information, and satisfies recordkeeping requirements. Reporting modules may be present, but they are not configured for structured or standardized data collection.
Connection to Taxpayer ROI at level 1
At Level 1, no form of Taxpayer ROI can be calculated, whether Fiscal, Economic, or Effectiveness. The government can show where funds went but not what those funds accomplished.

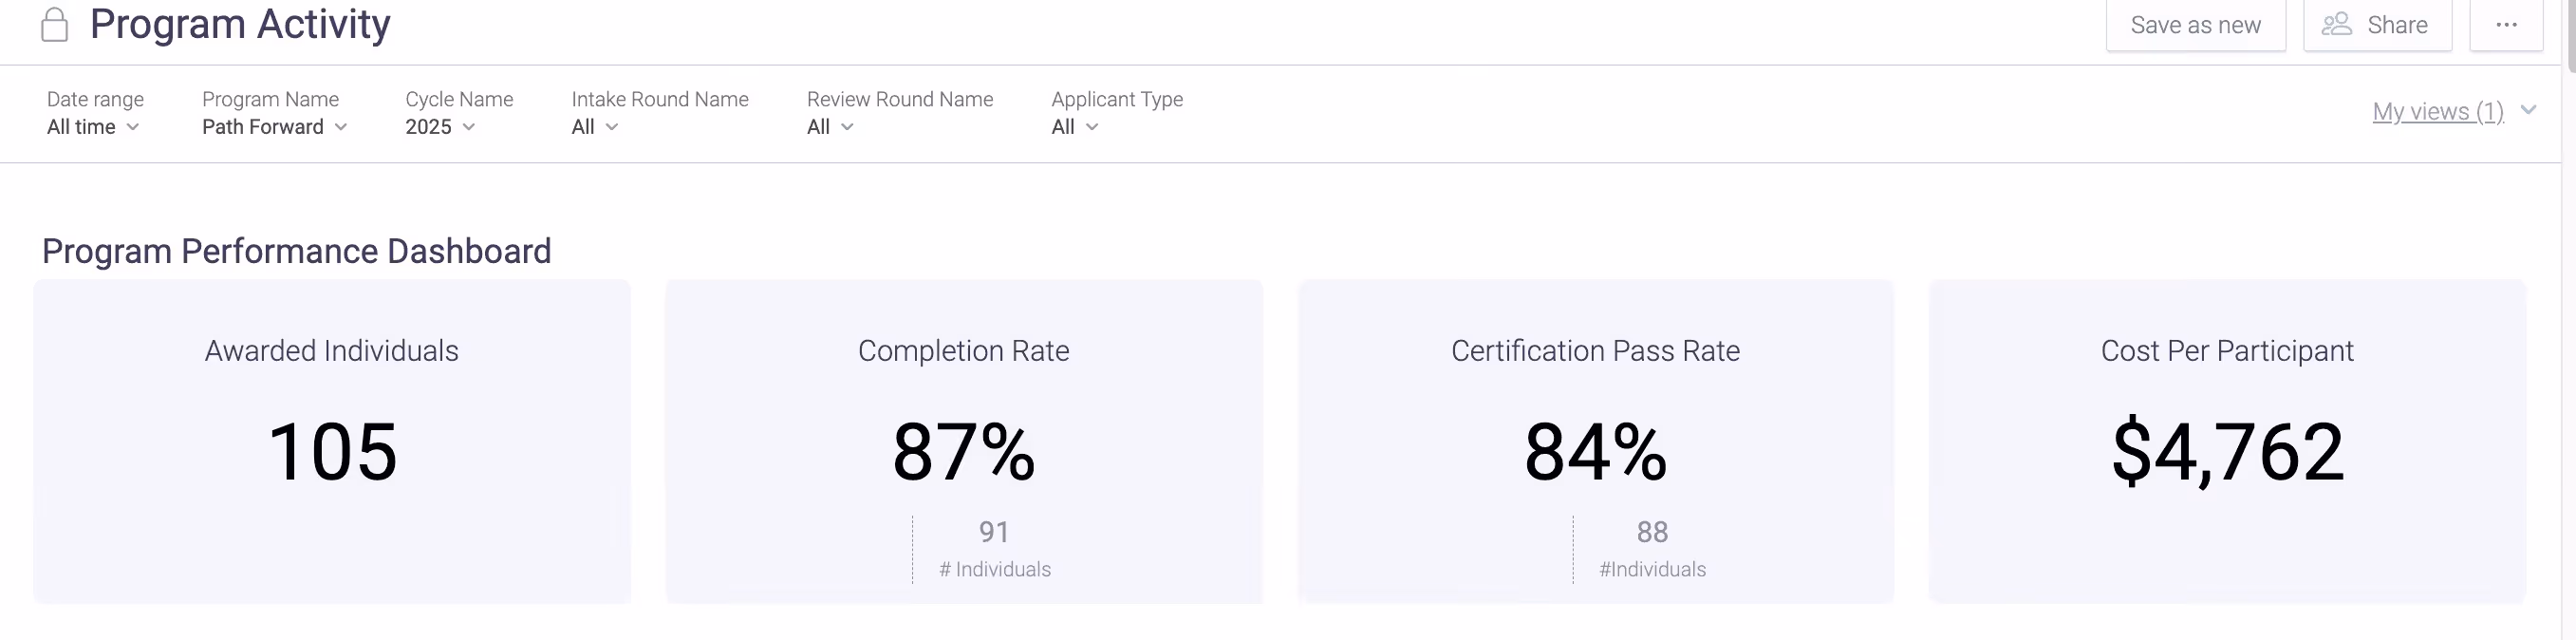
At Level 1, the PathForward initiative can show that it spent $487,300 of its $500,000 grant and returned $12,700 to the state. The GMS tracks obligations and expenditures — but nothing about what those dollars accomplished. This is where most grant programs start.
Level 2: Output awareness
“We know what we did.”
Governments and recipients begin to track outputs in a consistent way. Outputs might include people served, services delivered, or activities completed. This is the moment where the word “performance” begins appearing in reports, although usually in a modest and cautious way.
Government characteristics at level 2
Governments introduce standard output indicators in NOFOs and grant agreements. Reporting templates become more structured. Some automated systems appear, often through new GMS tools or statewide reporting platforms. Cost per output becomes the primary measure of efficiency.
Recipient characteristics at level 2
Recipients validate various counts, track repeat participation, and begin to use demographic categories aligned with agency requirements. A few have case management tools, but many still rely on spreadsheets.
Role of the GMS at level 2
The GMS is now configured with structured fields for output reporting. Agencies define required indicators directly in the system. Dashboards begin surfacing basic metrics such as number of households served or number of services delivered.
Connection to Taxpayer ROI at level 2
Level 2 unlocks the first building blocks of effectiveness ROI, though still incomplete. Governments can calculate cost per output, but they cannot yet determine whether those outputs created meaningful change.
Level 3: Outcome capable
“We know what changed.”
This level represents a major shift. Governments and nonprofits adopt logic models, develop shared outcome definitions, and collect short-term outcome data.
Government characteristics at level 3
Governments add required outcome indicators to NOFOs and create performance frameworks that connect activities to results. Data dictionaries standardize definitions. Staff review outcomes annually and update targets based on learning.
Recipient characteristics at level 3
Recipients implement pre and post assessments, follow up with participants, and document verifiable change. They track job placements, housing stability, educational progression, or other outcomes tied directly to the funded program.
Role of the GMS at level 3
A GMS becomes essential. Agencies embed outcome definitions, require structured reporting templates, and collect verified outcome evidence through forms or assessments.
Connection to Taxpayer ROI at level 3
Level 3 enables meaningful effectiveness ROI. Governments can calculate cost per successful outcome, outcome achievement rates, and comparisons to baselines or peers.
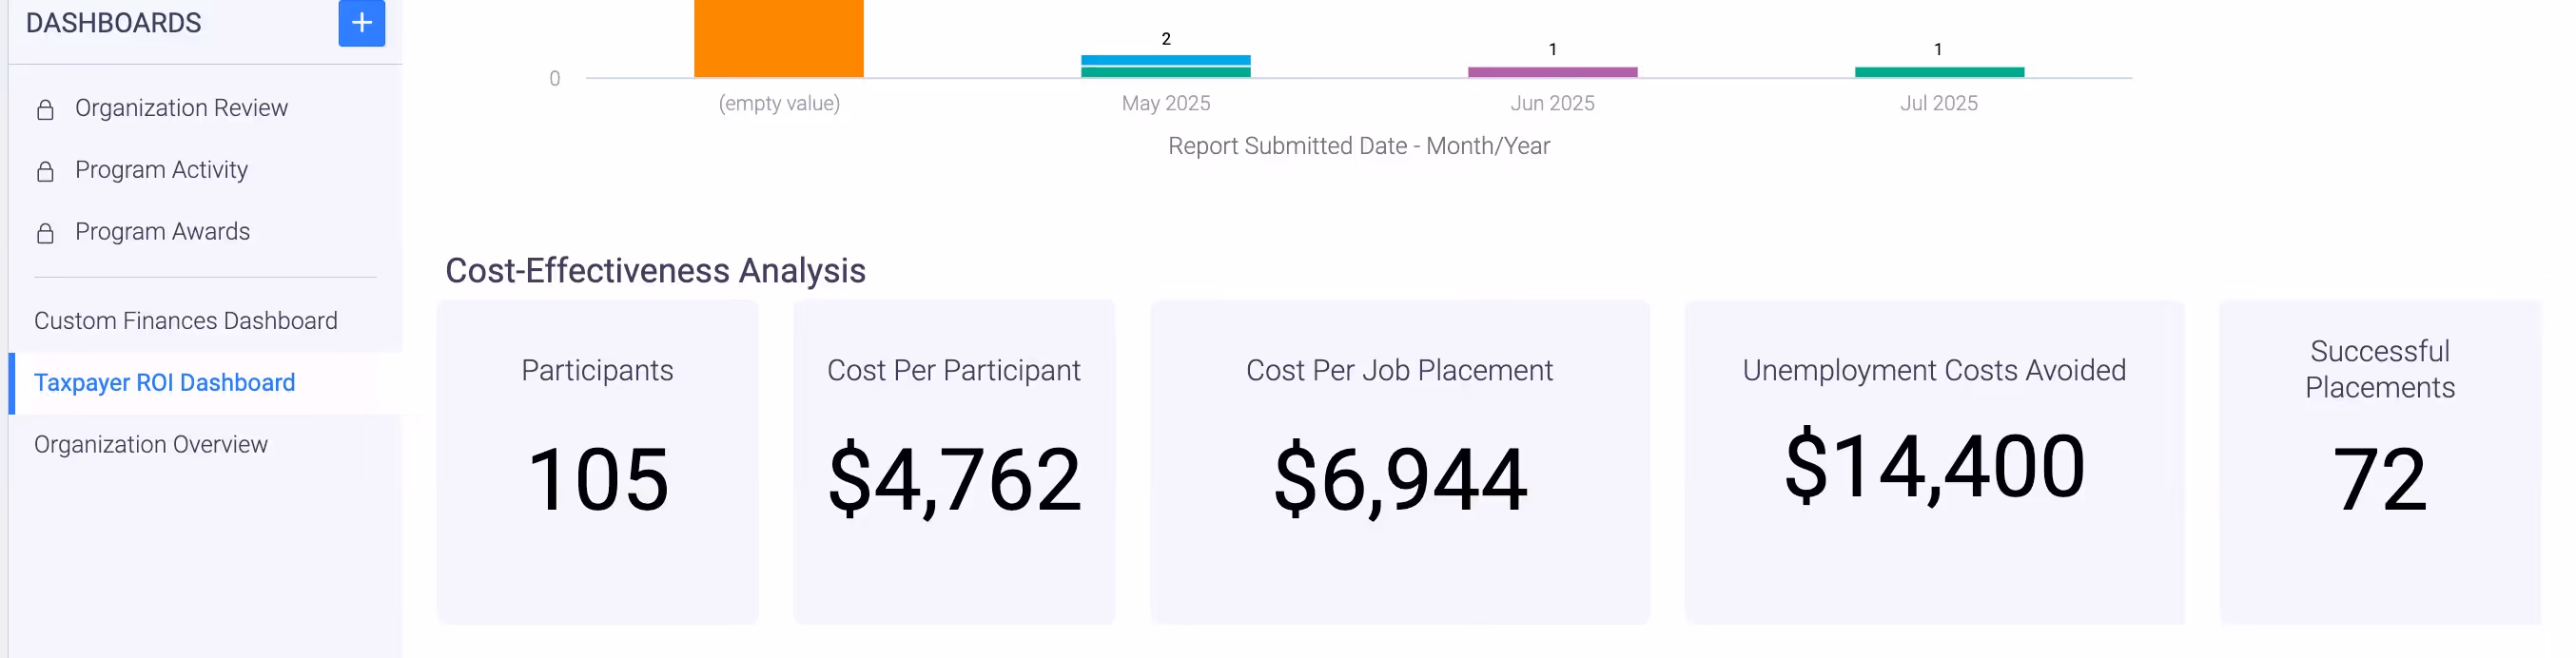
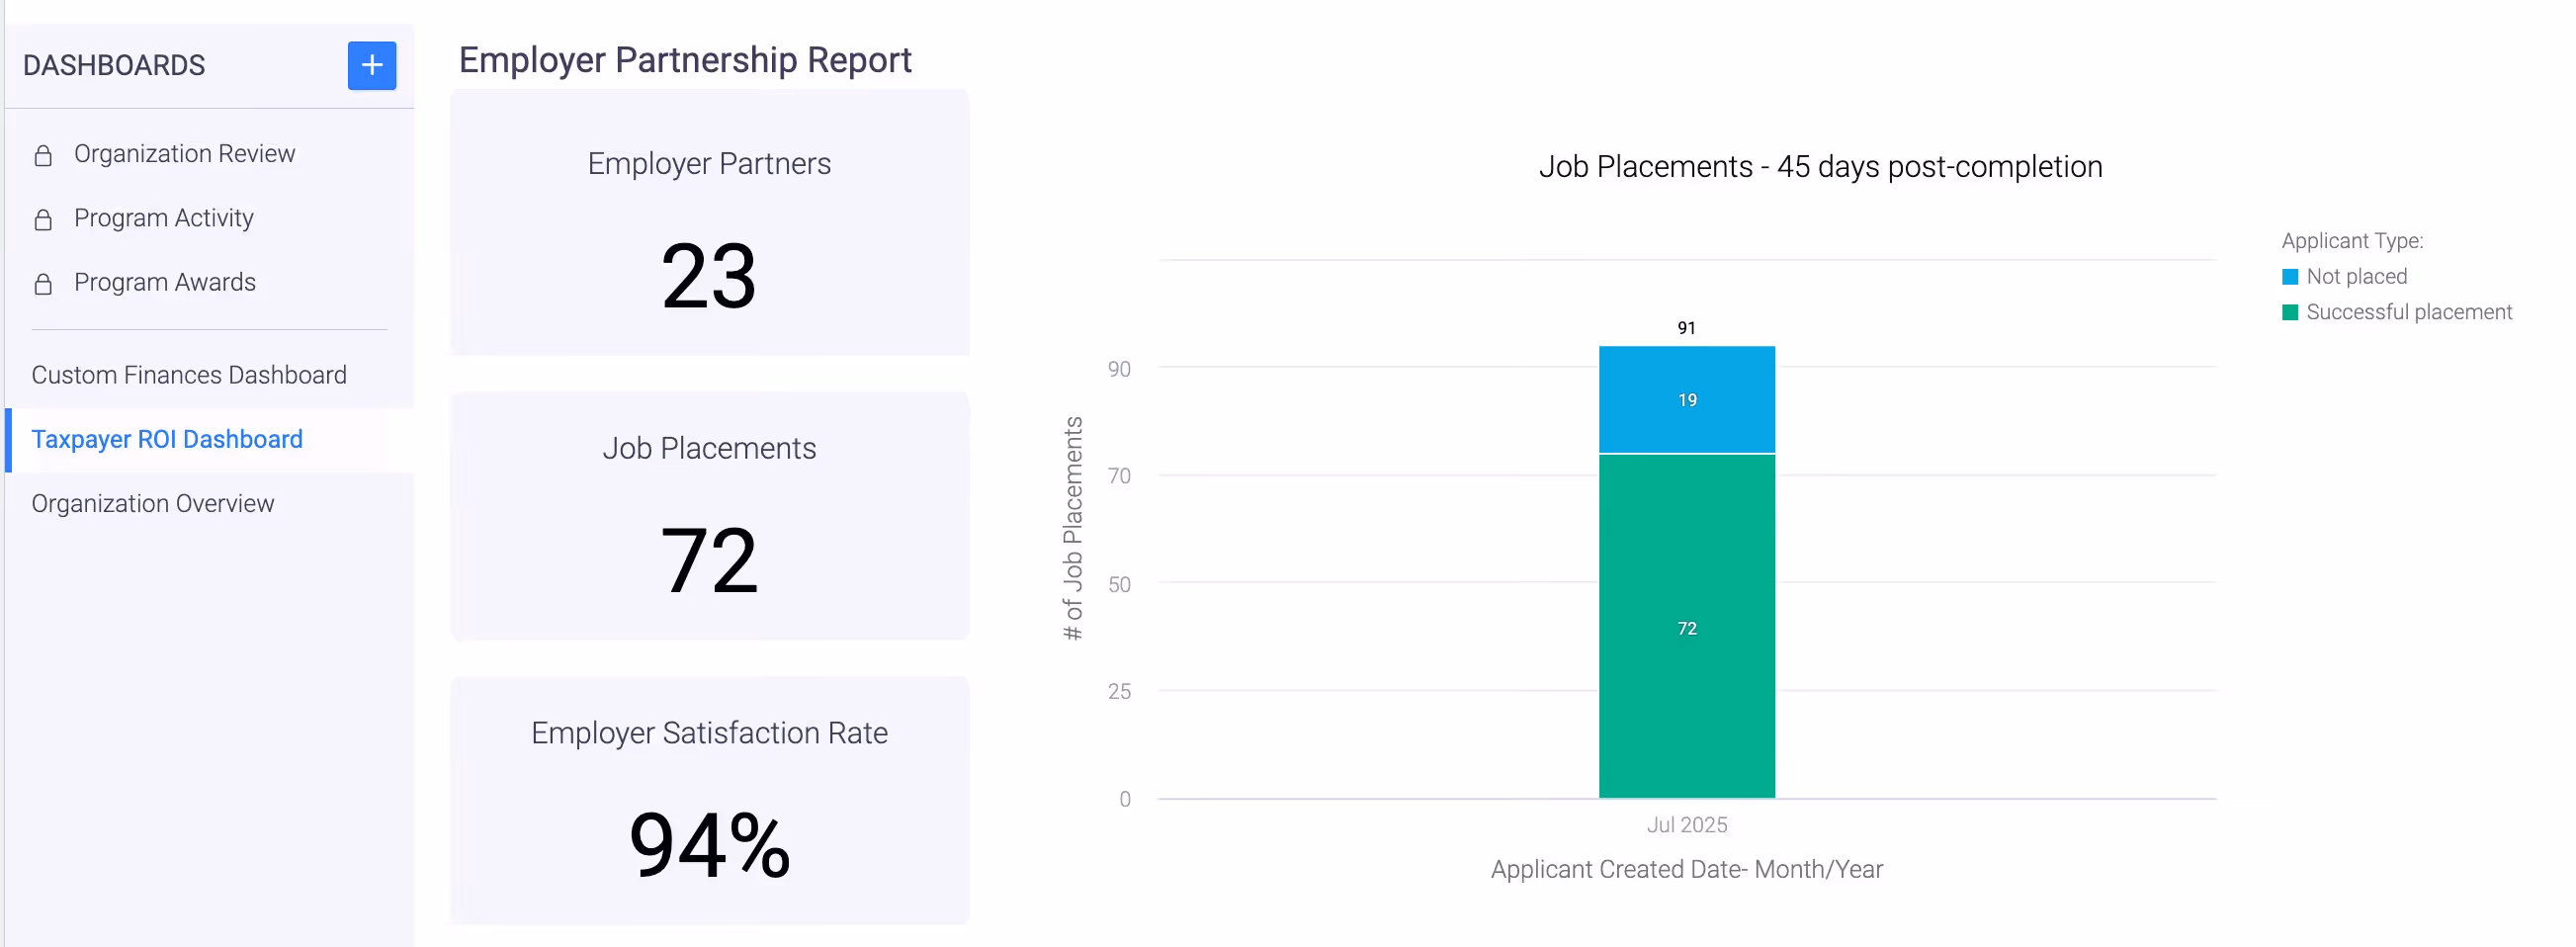
At Level 3, PathForward can report that 72 graduates were placed in tech jobs within an average of 45 days — a 79% employment rate at six months. The cost per successful job placement was $6,944. With 23 employer partners and a 94% employer satisfaction rate, the program can demonstrate verifiable change, not just activity. This is where effectiveness ROI becomes real.
Level 4: Economic value enabled
“We know the dollar value of change.”
This level introduces the ability to monetize benefits and calculate economic or social returns.
Government characteristics at level 4
Governments collect longitudinal data, integrate administrative datasets, and collaborate across departments. Dashboards display not only outcomes but also economic value.
Recipient characteristics at level 4
Recipients track long-term participant status and work with evaluators to document monetized benefits such as increased wages or reduced service utilization.
Role of the GMS at level 4
The GMS becomes the authoritative source of structured, validated output and outcome data used for economic analysis. Agencies export standardized datasets for evaluators.
Connection to Taxpayer ROI at level 4
Level 4 produces economic ROI. Governments can quantify benefits like avoided healthcare or shelter costs, increased earnings, and broader community value.
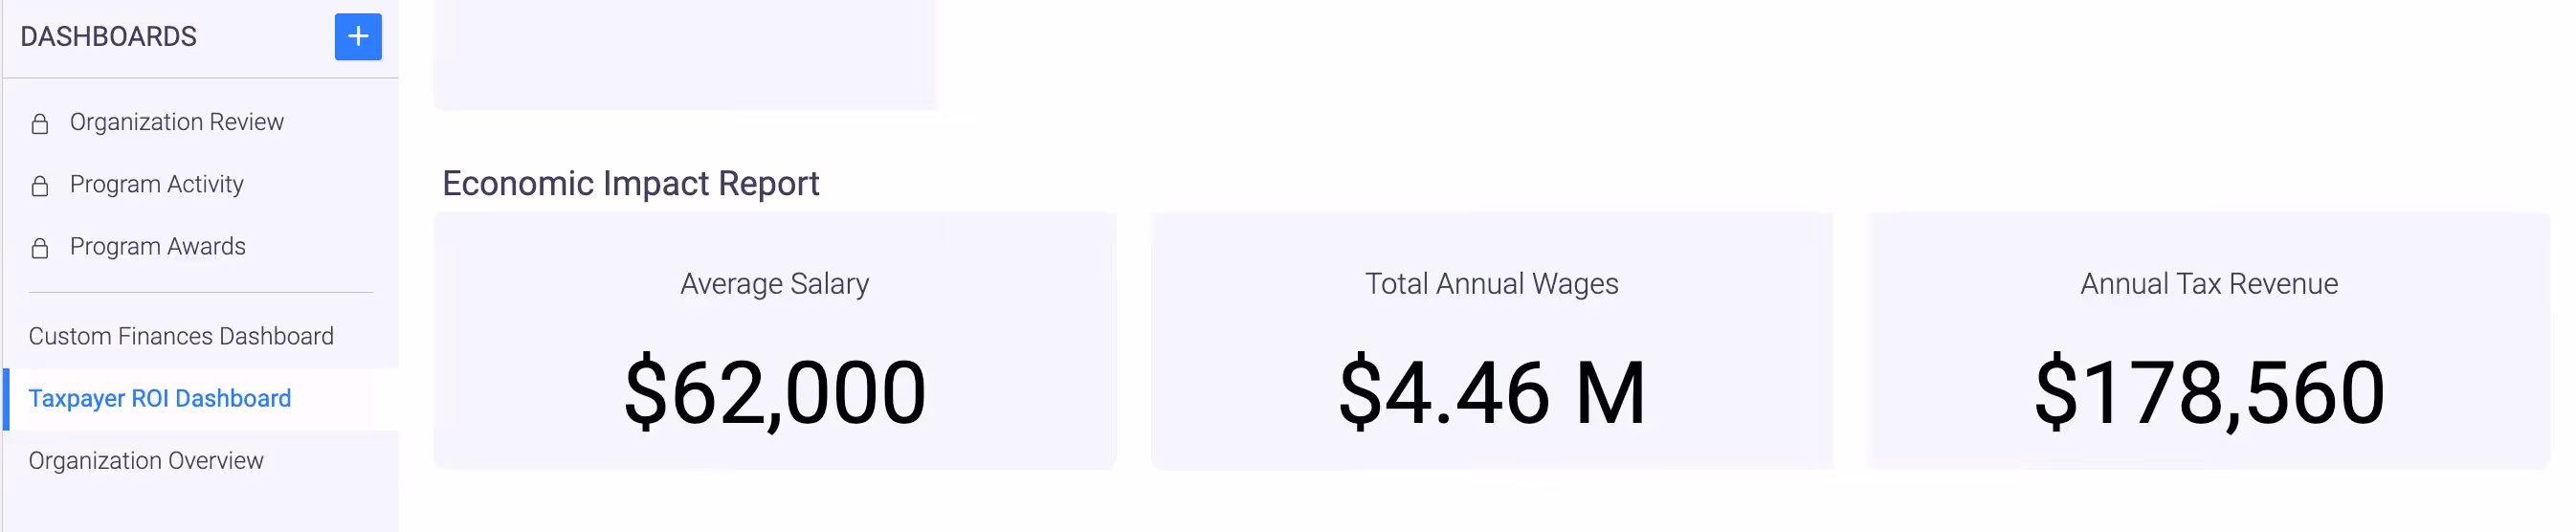
At Level 4, PathForward can monetize its outcomes: $4.4M in annual wages generated, ~$178,560 in estimated state income tax revenue per year, and $14,400 in avoided unemployment costs per placement.
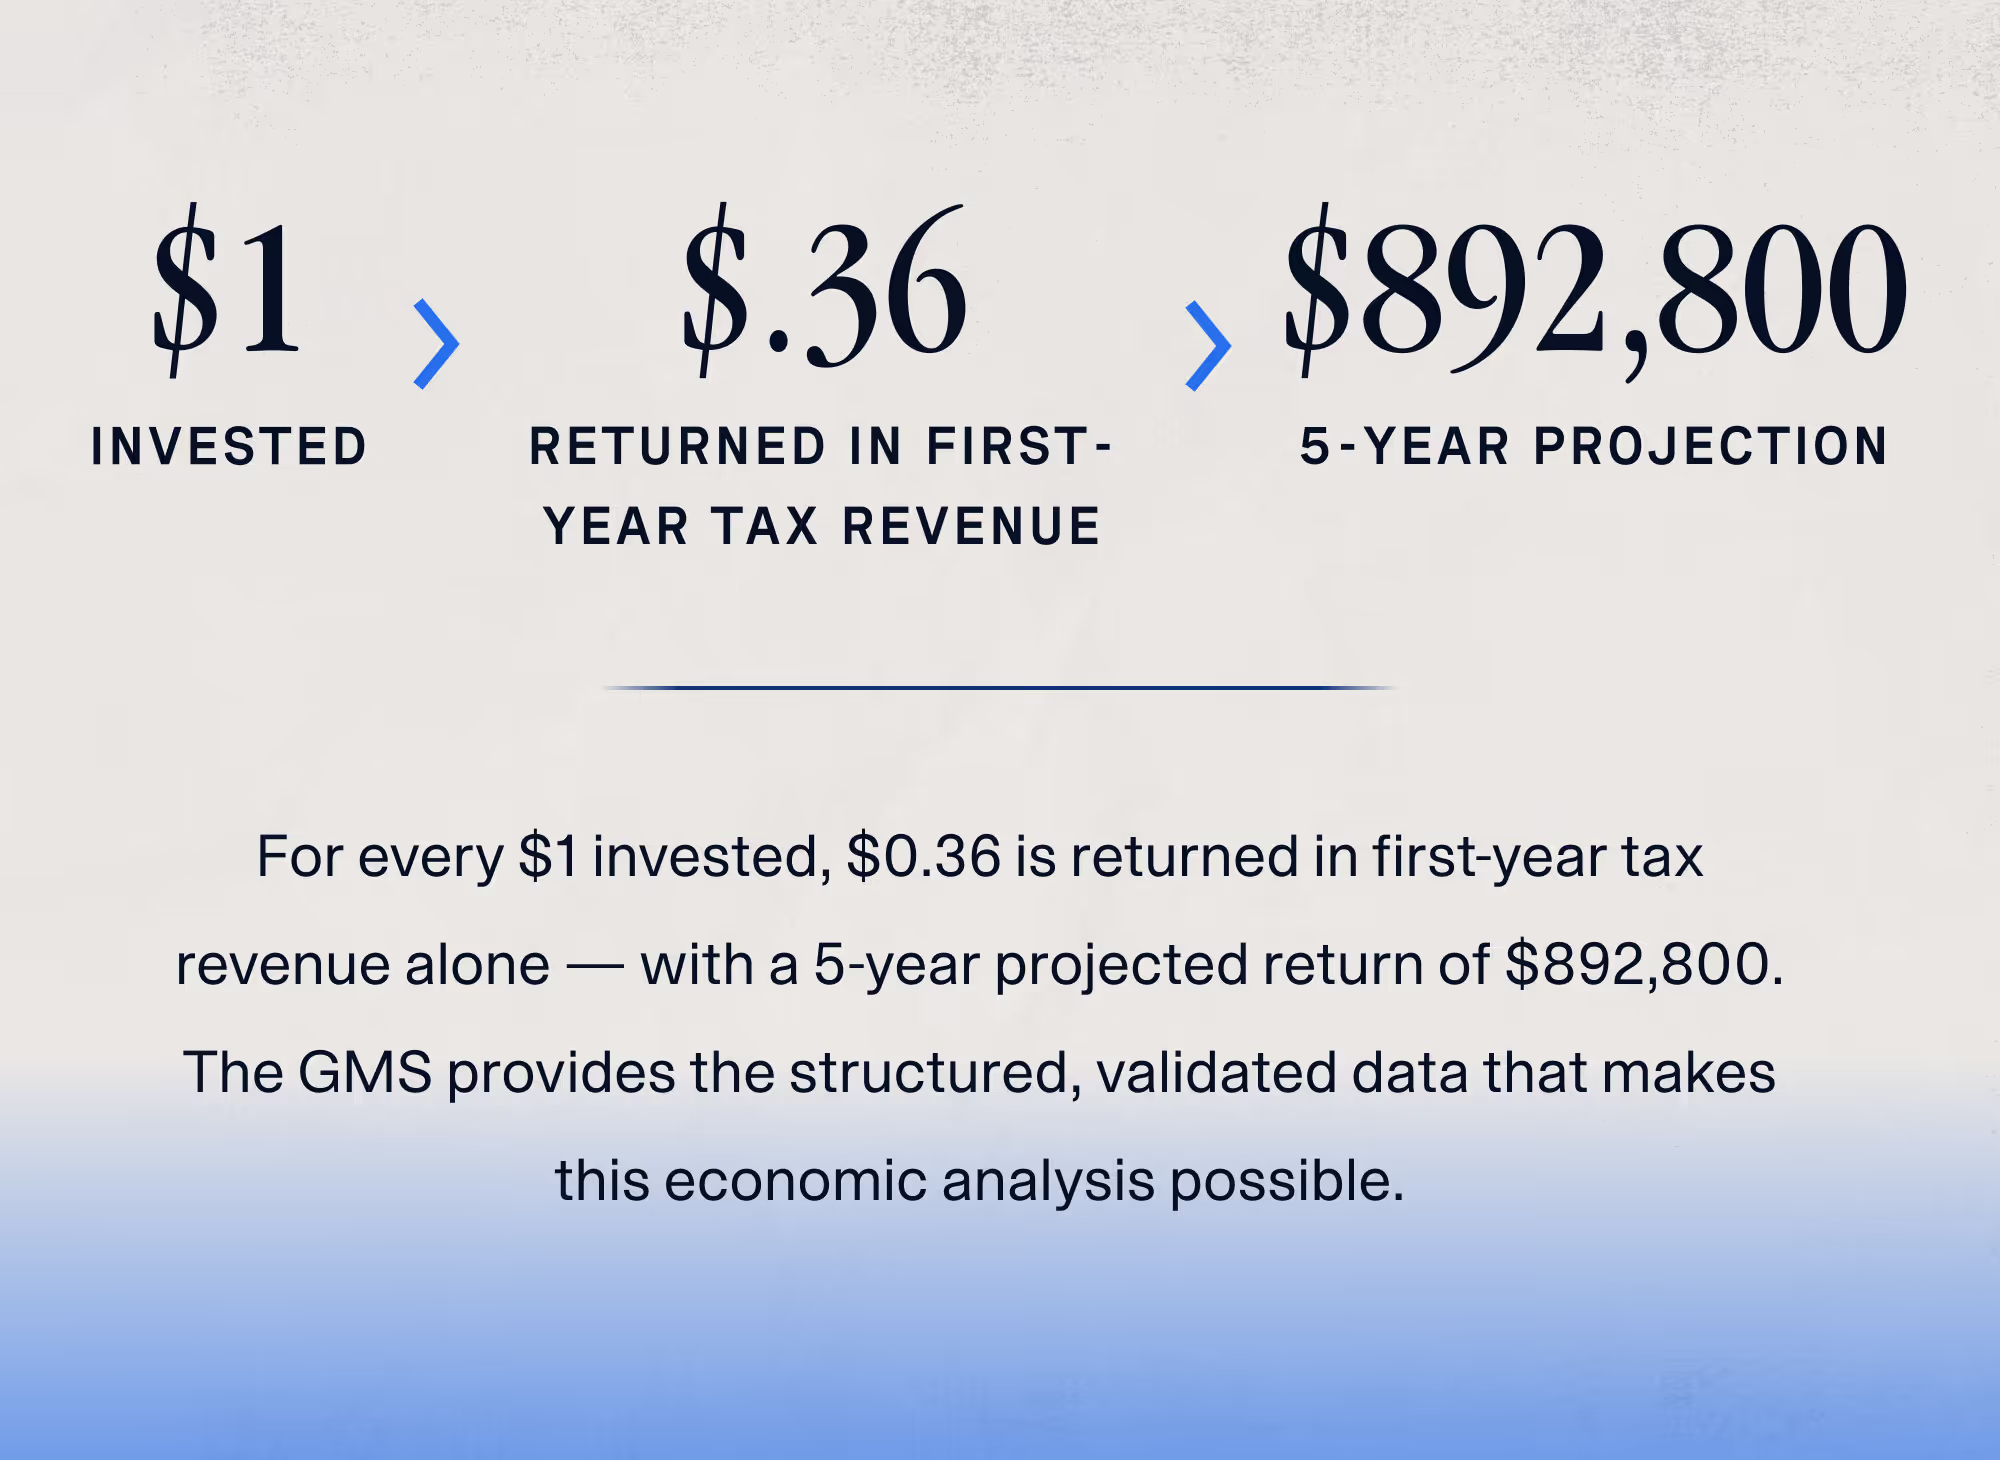
Based on the PathForward example: $500,000 invested, $178,560 in annual state tax revenue generated, returning the full public investment in under three years.
Level 5: Strategic, distributional, and predictive
“We optimize for value and distributional impact at the same time.”
At the most advanced level, governments manage programs proactively and incorporate equity into ROI analysis.
Government characteristics at level 5
Governments deploy integrated data systems, conduct cross-program comparisons, and publish public-facing dashboards. They track not only total benefits but distribution of benefits.
Recipient characteristics at level 5
Recipients refine interventions using data-informed insights and collaborate closely with agencies on shared measurement and learning.
Role of the GMS at level 5
A modern GMS enables distribution-sensitive outcomes, geospatial tagging, demographic analysis, and predictive modeling.
Connection to Taxpayer ROI at level 5
Level 5 enables full-spectrum ROI:
- Fiscal savings
- Economic benefits
- Effectiveness improvements
- Distributional impact in who receives those benefits
This is the highest expression of taxpayer value.
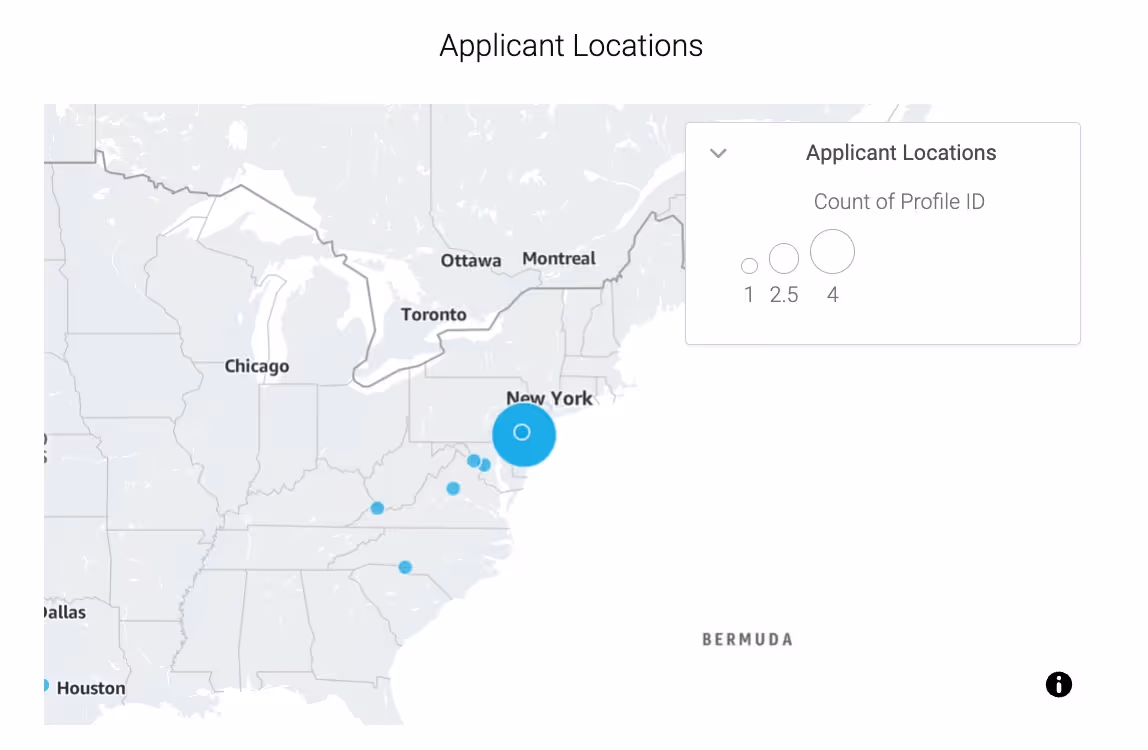
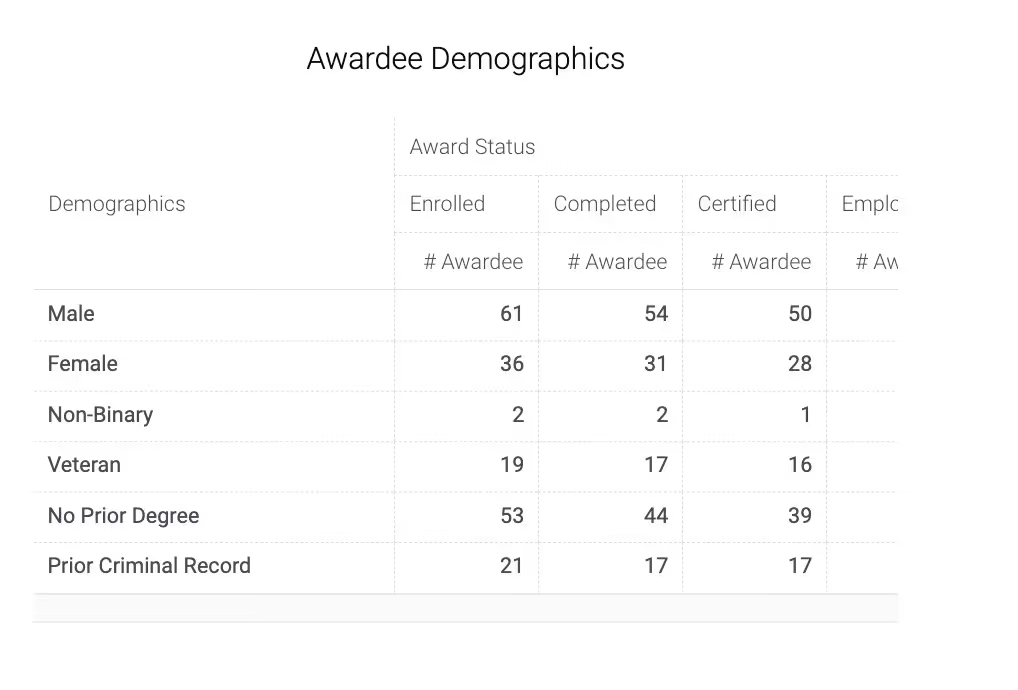
At Level 5, PathForward doesn't just report total impact — it reports who benefited. Geographic distribution shows which counties and districts were reached. Demographic breakdowns reveal the percentage of veterans, women in tech, and participants from disadvantaged communities served. Barrier reduction data shows how many participants with prior criminal records or long-term unemployment are now employed. This is distributional ROI: not just how much value was created, but whether it reached the people and places that needed it most.
Why governments need a maturity model
Taxpayer ROI is not a single formula. It is the natural result of stronger data systems, clearer expectations, improved reporting processes, and deeper partnerships between governments and nonprofits. A maturity model provides governments with a clear roadmap for improving measurement and demonstrating value.
Agencies subject to uniform guidance, performance reporting, monitoring, and continuous improvement can use this model to align expectations and strengthen program reporting and valuation. Nonprofit partners gain clarity about which data matters most and why.
Above all, the model provides a path for governments to demonstrate public value in a way that is credible, transparent, and accessible to the people who finance the system. Taxpayers deserve to know what their money accomplishes. This maturity model helps show them.
The PathForward Tech Training Initiative started with a $500,000 investment and basic expenditure tracking. By progressing through each maturity level, the organization can now tell a complete story: $4.4M in annual wages generated, 72 families moving to economic stability, and taxpayers recovering their investment in under 3 years through income tax revenue alone. That story is only possible when a GMS is configured to capture the right data at each stage — and when grantmakers and grantees build that capability together.

Sam Caplan is the Vice President of Social Impact at Submittable, a platform that foundations, governments, nonprofits, and other changemakers use to launch, manage, and measure impactful granting and CSR programs. Inspired by the amazing work performed by practitioners of all stripes, Sam strives to help them achieve their missions through better, more effective software.
Sam formerly served as founder of New Spark Strategy, Chief Information Officer at the Walton Family Foundation, and head of technology at the Walmart Foundation. He consults, advises, and writes on social impact technology, strategy, and innovation.
Connect with or follow Sam on Linkedin, listen to his podcast Impact Audio, and subscribe to his bi-weekly newsletter The Review.

Submittable customers love using our software. But don't just take our word for it. See what grant and CSR program managers have to say about Submittable.